


I was lucky to be able to spend last November and December on the Maine coast, not a bad place to be living more-or-less in quarantine, and being still nervous about air travel my partner Aaron and I drove both ways from California. (We brought all of our food with us and were extra fastidious about selecting and sanitizing hotel rooms.) People enjoy—or avoid—long road trips for many reasons, but for me the main attraction is (you guessed it) observing the changes in vegetation, even where most landscapes are human-dominated. Most of the climatic gradients I’ve talked about so far have been on a much smaller scale—typically small islands and mountains—because the reason I find these gradients so empowering to begin with is that they represent typically vast and overwhelming phenomena made comprehensible. The sharper the transition from hot to cold or wet to dry, the easier it is to grasp. But this trip reminded me that gradients on the scale of a continent are exciting too in their own way, and in one sense even more so. The key is to experience them at the right speed and distance.

La Gomera in the Canary Islands—a dramatic example of a small-scale climatic gradient (my typical focus).
Small-scale temperature and precipitation gradients usually exist because of dramatic topography, creating a rain shadow effect or altitudinal zonation. Contrasts over longer distances can of course be created by topography too—think of the landscapes on either side of the Rockies or Sierra Nevada—but they don’t have to be. The transition from the moist forests of the eastern U.S. to the semiarid high plains (steppes) happens over only minor or barely perceptible elevation changes. And the routes we took on this cross-country trip, I-80 eastward and (for most of the way) I-44 and I-40 westward, pass north and south of the Rockies so that the steppe-to-desert transition also happens with relatively minimal topographical variation. These gradients, then, seem superficially to exist for no reason—the conditions that create them, having to do with complex interactions between the atmosphere, oceans, and landmasses, aren’t part of the experience. Paradoxically this lack of an obvious physical feature to compress the gradient—the very fact that it’s something more planetary and “unknowable” in nature—for me partly compensates for the great distance involved.
But obviously in extending over many hundreds of miles, long gradients like this are hard to experience. Along the two routes we took, the portions with a relatively linear and perceptible change—roughly from Wyoming to Illinois and then back west to New Mexico—covered between 1,000 and 1,300 miles. (Things do get wetter and drier further east and west of those places, but less obviously so, and the pattern becomes more complicated and influenced by mountains.) Traveling those routes requires more than a spur-of-the-moment drive, let alone a hike. But doing them in a relative hurry, as we did given that Covid discouraged us from making more rest or hotel stops than necessary, did have a compressing effect—embodied by that frequent “can you believe we were in x only a few hours ago?” feeling. (Later on I’ll mention why this has to be done on the ground, “close at hand”; flying is a very different type of journey.)

Our two routes across the U.S., overlaid on a precipitation map. The thicker yellow lines represent the segments (mentioned above) where the gradient is most obvious, for simplicity and familiarity’s sake from Cheyenne to Chicago and St. Louis to Albuquerque (roughly bisected by Omaha and Oklahoma City, respectively). The yellow box in the legend highlights the precipitation bands that fall within these segments. (Map from https://gisgeography.com/us-precipitation-map/)
I’ve focused quite a bit, as you know, on the small-scale type of gradient in the worldviews, but I’ve only dabbled in the continent-scale variety—in a later post I’ll go into the topic of capturing the latter in two dimensions, in terms of this road trip and in general. For now I’ll just share a few images to provide a taste, and say that my standard “fracturing” technique isn’t necessarily the way to go.
Below I’ve aligned strips of the satellite view along my selected segments of the northern and southern routes (the thicker lines in the diagram above) with the precipitation map. The idea is to frame the green-to-brown gradient along the two routes in a way that I think is more revealing than just the overall U.S. satellite map would be. Had I created it before the trip it might’ve led me to compare my experience on the ground with what the aerial view would predict. Doing that now based on memory, combined with the fact that significant portions of the driving were through snow or in the dark, isn’t ideal, but it’s still interesting to try. (In fact from here on I’m going to cheat a bit. The part of the northern/west-east drive where most of the perceptible change happens—between eastern Wyoming and central Nebraska—was all either at night or snow-covered. So I’m going to substitute my memory of that drive with an even older memory of the same trip but in the opposite direction—from the time I drove it, in just as much of a rush, on my move from Cleveland to San Francisco ten years ago. Missing that chunk of the view this time around was very frustrating, and I’m genuinely curious if this ever bothers anyone besides me. At least I do have that other memory to fall back on, but the west-to-east experience can’t necessarily just be replaced by the reverse. I’ve learned from other places that each direction has its own takeaways.)

Green-to-brown gradients along the two routes (the thick yellow lines in the first diagram), with the six cities at the start-, end-, and mid-points outlined in black. The yellow numbers show the locations of the photos below. (Satellite views from Google Maps)
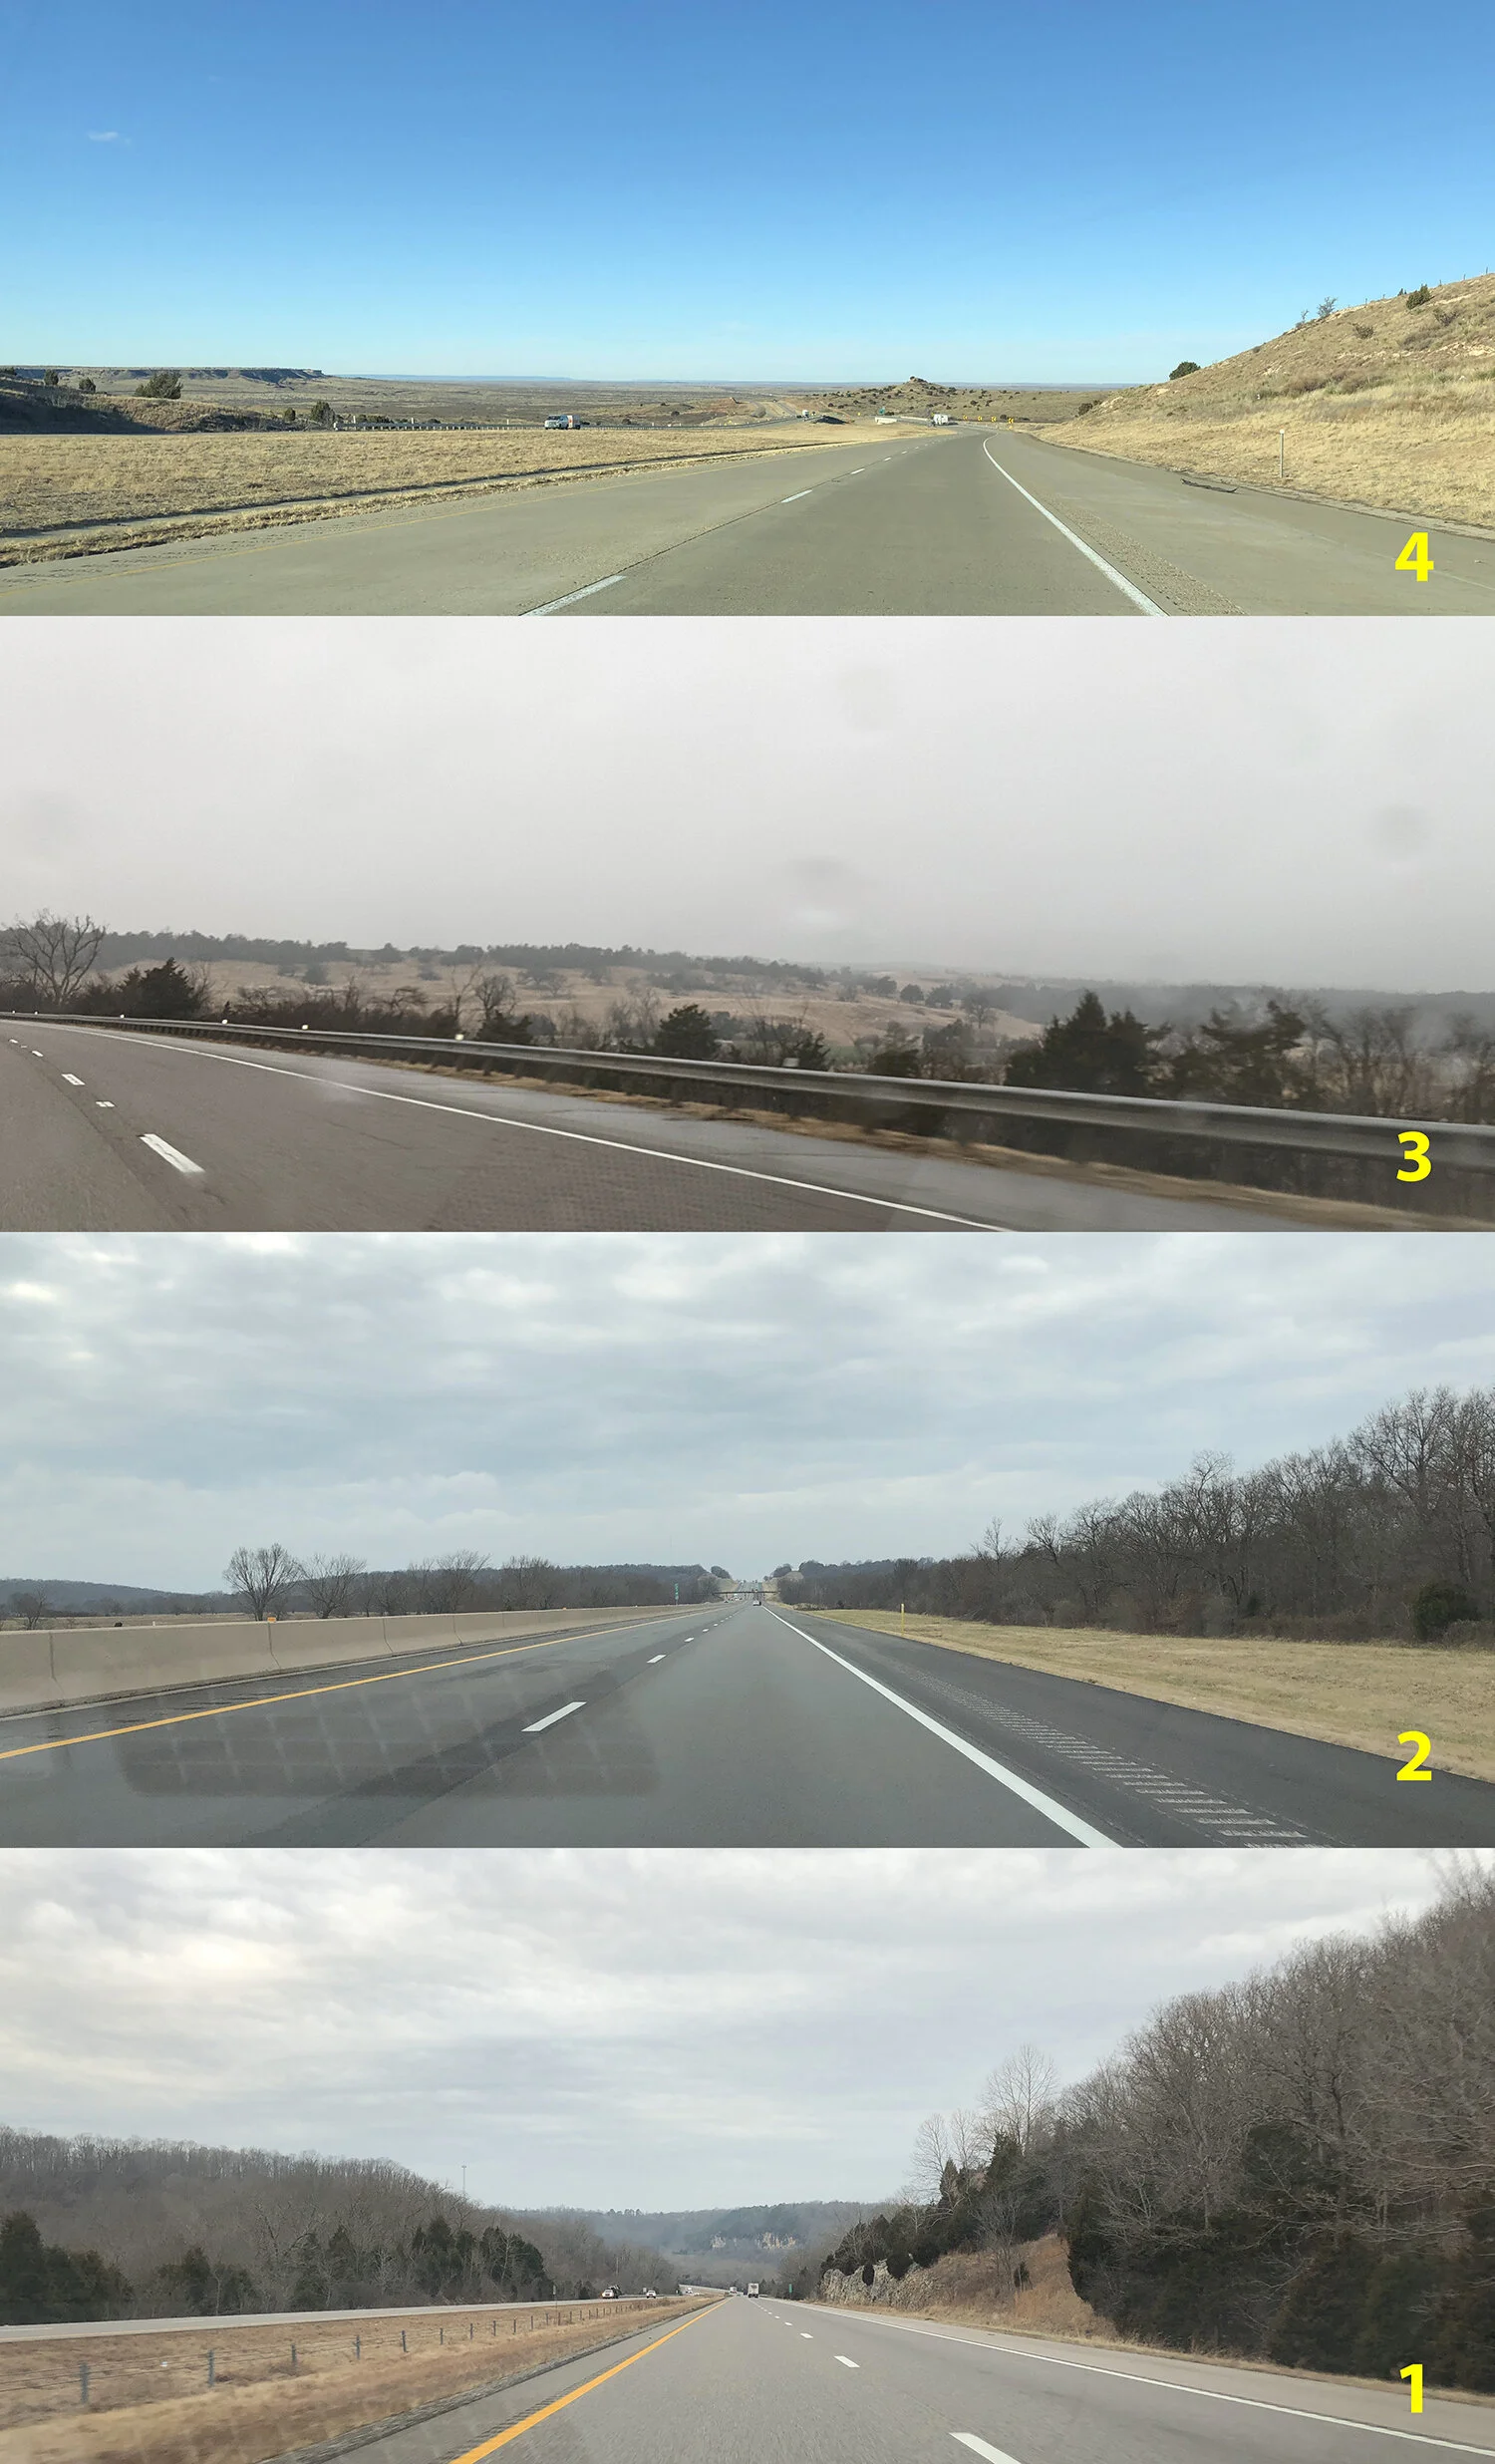
A few views from the car driving westward along the southern route (from bottom to top) giving a taste of the wet-to-dry transition. The numbers identify their locations on the satellite view in diagram.
The satellite views seem to show that the transition isn’t completely smooth, but rather most rapid around central Nebraska and central Oklahoma. That could be for a variety of reasons other than what’s actually happening on the ground—like coloration of the image, or the fact that we’re not talking about a simple forest-to-desert gradient but instead a much more complex mix of landscapes from quasi-native to completely managed, which complicates the green-to-brown representation. But I do remember the landscape seeming to transition most perceptibly from “familiar” (thinking as an Ohio native) to “less familiar” in that zone. More on this later, with more photos, in the context of representation. But needless to say there’s also plenty that can’t be perceived from the aerial—like the fact that the landscape seemed to take on a vaguely “rough” or “weathered” element in western Iowa and western Missouri (again, as if driving both routes in the westward direction), and then really felt like “the West” just before the Wyoming and New Mexico borders.
More to come soon!
Darren